Quick answer: An R32 pressure-temperature (PT) chart matches refrigerant pressure with the temperature where R32 changes between liquid and vapor. This is called saturation temperature. Use the chart as a reference only. It does not give one “normal” suction pressure, discharge pressure, or charging pressure for every system. At Airproz, we also check pipe temperature, load, airflow or water flow, compressor operation, controls, and the manufacturer’s data before we judge an R32 air conditioner or heat pump.
R32 PT Chart Quick Reference
Need a quick number? Start with this table. These values show R32 saturation pressure at each temperature. They do not show the pressure every running system should have.
| Saturation Temperature | R32 Pressure | bar(g) | kPa(g) |
|---|---|---|---|
| 0°F / -17.8°C | 49.3 psig | 3.40 bar(g) | 340 kPa(g) |
| 20°F / -6.7°C | 80.0 psig | 5.52 bar(g) | 552 kPa(g) |
| 40°F / 4.4°C | 121.0 psig | 8.34 bar(g) | 834 kPa(g) |
| 60°F / 15.6°C | 174.1 psig | 12.00 bar(g) | 1200 kPa(g) |
| 80°F / 26.7°C | 241.5 psig | 16.65 bar(g) | 1665 kPa(g) |
| 100°F / 37.8°C | 325.7 psig | 22.46 bar(g) | 2246 kPa(g) |
| 120°F / 48.9°C | 429.3 psig | 29.60 bar(g) | 2960 kPa(g) |
| 140°F / 60.0°C | 555.8 psig | 38.32 bar(g) | 3832 kPa(g) |
If you only have a pressure reading, use the chart to find saturation temperature. Do not use one pressure reading to say the charge is correct, the system is healthy, or a specific part has failed.
R32 Pressure ↔ Saturation Temperature Lookup
Use this for a fast R32 PT reference. The lookup uses the same 5°F data points as the full Airproz table below and interpolates between them. Treat an in-between result as an approximate chart lookup, not as a replacement for the exact service data for your equipment.
Boundary: this tool converts R32 pressure and saturation temperature. It does not calculate a universal suction pressure, discharge pressure, refrigerant charge, capacity, or fault diagnosis.
Full R32 Pressure Temperature Chart: -40°F to 150°F
We use this full R32 pressure temperature chart when we check a refrigeration cycle. The R32 values in psig come from published manufacturer PT data. We converted the same gauge-pressure values into bar(g) and kPa(g). For charging, start-up checks, or service work, always follow the current service data for the exact equipment and use calibrated instruments.
Units: psig = pounds per square inch gauge; bar(g) = bar gauge; kPa(g) = kilopascals gauge.
| Temp (°F) | Temp (°C) | Pressure (psig) | Pressure bar(g) | Pressure kPa(g) |
|---|---|---|---|---|
| -40 | -40.0 | 11.0 | 0.76 | 76 |
| -35 | -37.2 | 14.4 | 0.99 | 99 |
| -30 | -34.4 | 18.2 | 1.25 | 125 |
| -25 | -31.7 | 22.3 | 1.54 | 154 |
| -20 | -28.9 | 26.8 | 1.85 | 185 |
| -15 | -26.1 | 31.7 | 2.19 | 219 |
| -10 | -23.3 | 37.1 | 2.56 | 256 |
| -5 | -20.6 | 42.9 | 2.96 | 296 |
| 0 | -17.8 | 49.3 | 3.40 | 340 |
| 5 | -15.0 | 56.1 | 3.87 | 387 |
| 10 | -12.2 | 63.5 | 4.38 | 438 |
| 15 | -9.4 | 71.4 | 4.92 | 492 |
| 20 | -6.7 | 80.0 | 5.52 | 552 |
| 25 | -3.9 | 89.2 | 6.15 | 615 |
| 30 | -1.1 | 99.1 | 6.83 | 683 |
| 35 | 1.7 | 109.7 | 7.56 | 756 |
| 40 | 4.4 | 121.0 | 8.34 | 834 |
| 45 | 7.2 | 133.0 | 9.17 | 917 |
| 50 | 10.0 | 145.9 | 10.06 | 1006 |
| 55 | 12.8 | 159.5 | 11.00 | 1100 |
| 60 | 15.6 | 174.1 | 12.00 | 1200 |
| 65 | 18.3 | 189.5 | 13.07 | 1307 |
| 70 | 21.1 | 205.8 | 14.19 | 1419 |
| 75 | 23.9 | 223.2 | 15.39 | 1539 |
| 80 | 26.7 | 241.5 | 16.65 | 1665 |
| 85 | 29.4 | 260.9 | 17.99 | 1799 |
| 90 | 32.2 | 281.3 | 19.39 | 1939 |
| 95 | 35.0 | 302.9 | 20.88 | 2088 |
| 100 | 37.8 | 325.7 | 22.46 | 2246 |
| 105 | 40.6 | 349.7 | 24.11 | 2411 |
| 110 | 43.3 | 374.9 | 25.85 | 2585 |
| 115 | 46.1 | 401.4 | 27.68 | 2768 |
| 120 | 48.9 | 429.3 | 29.60 | 2960 |
| 125 | 51.7 | 458.7 | 31.63 | 3163 |
| 130 | 54.4 | 489.5 | 33.75 | 3375 |
| 135 | 57.2 | 521.8 | 35.98 | 3598 |
| 140 | 60.0 | 555.8 | 38.32 | 3832 |
| 145 | 62.8 | 591.4 | 40.78 | 4078 |
| 150 | 65.6 | 628.8 | 43.35 | 4335 |
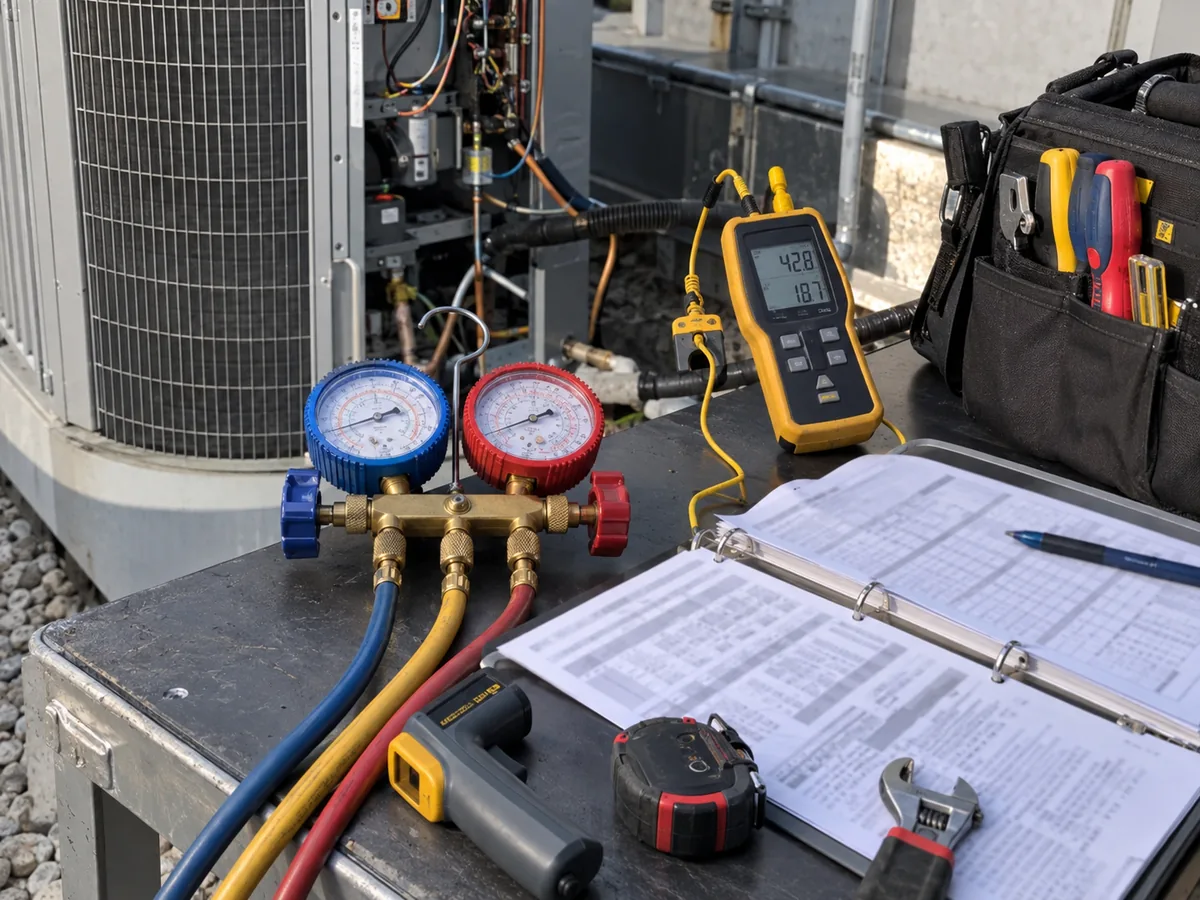
A simple way to read the chart is this: pressure tells you the saturation temperature of R32 at that pressure. It does not tell you the actual temperature of the copper pipe. You need a temperature sensor on the pipe for that.
R32 PT Data Source Receipt
We keep one consistent R32 saturation dataset through the chart instead of mixing rounded values from different websites. We use published Forane R32 PT data as the primary numeric reference and cross-check key points against manufacturer, property, and independent PT references. Small differences such as 0.1 psi can come from rounding.
| Role | Reference | How We Use It |
|---|---|---|
| Primary PT dataset | Arkema / Forane | Base R32 saturation pressure values used in this table |
| Thermophysical reference | NIST | Pure-fluid property basis and independent technical reference |
| Manufacturer cross-check | Daikin R32 service data | Cross-check of practical R32 service points |
| Independent PT cross-check | Hudson Technologies | Cross-check of published R32 PT values and rounding |
Use rule: when the exact equipment service manual gives a value or procedure for the unit you are working on, that equipment-specific data takes priority over this general reference.
How R32 Saturation Pressure Changes With Temperature
What an R32 PT Chart Actually Tells You
An HVAC pressure temperature chart answers one main question: what saturation temperature matches this refrigerant pressure? Higher saturation pressure means a higher saturation temperature. Lower pressure means a lower saturation temperature.
R32 is the refrigerant difluoromethane. It is a single-component refrigerant, which means it is one refrigerant rather than a blend. For normal HVAC PT-chart work, we use one saturation line. We do not need separate bubble-point and dew-point columns like we do for some refrigerant blends.
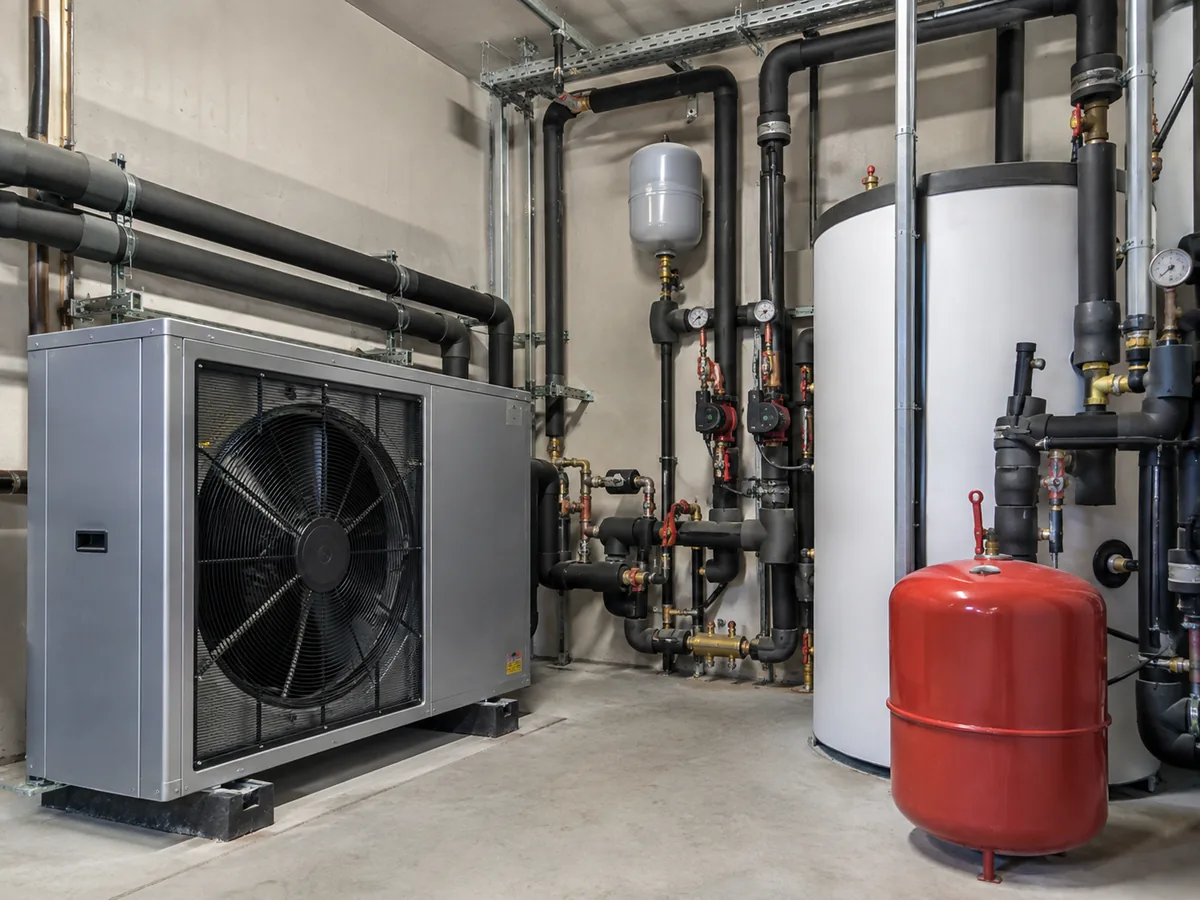
The chart only describes the pressure-temperature relationship of the refrigerant. A running air conditioner or heat pump is more complicated. Compressor speed, pressure loss, heat transfer, the expansion valve, airflow or water flow, and the actual load can all change the readings. So the PT chart gives us one useful reference point, but it cannot diagnose the whole system by itself.
Is My R32 Pressure Normal?
You cannot tell whether an R32 system is running normally from pressure alone. First, use the pressure to find saturation temperature. Then compare that result with the real operating conditions.
When we check an R32 system, we look at pressure and pipe temperature together. We also check indoor and outdoor temperature, system load, airflow or water flow, compressor speed, fan operation, expansion-valve control, coil condition, and the test condition in the manufacturer’s manual. This matters even more on inverter equipment because compressor speed can change while the system is still working normally.
Not enough to judge charge or system health.
Gives the matching saturation temperature.
Lets us calculate superheat or subcooling.
Adds load, ambient temperature, airflow or water flow, compressor state, and controls.
Now the operating point can be checked against the correct target for that equipment and test condition.
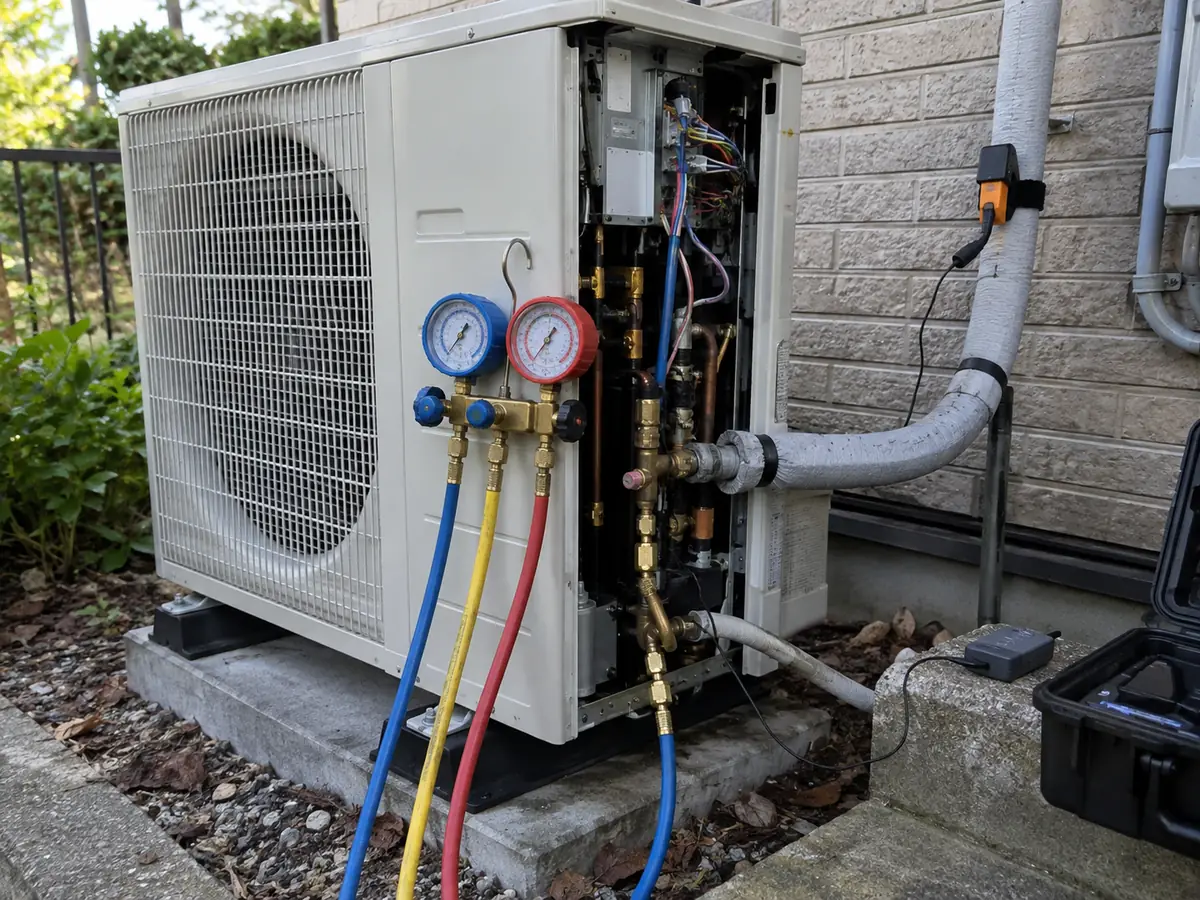
If key information is missing, we do not use one gauge reading as proof of undercharge, overcharge, correct charge, or system failure. Our refrigerant charging guide explains the separate charging process. Our inverter air conditioner guide explains why variable-speed operation can change the pressure you see.
How to Read an R32 Pressure Temperature Chart
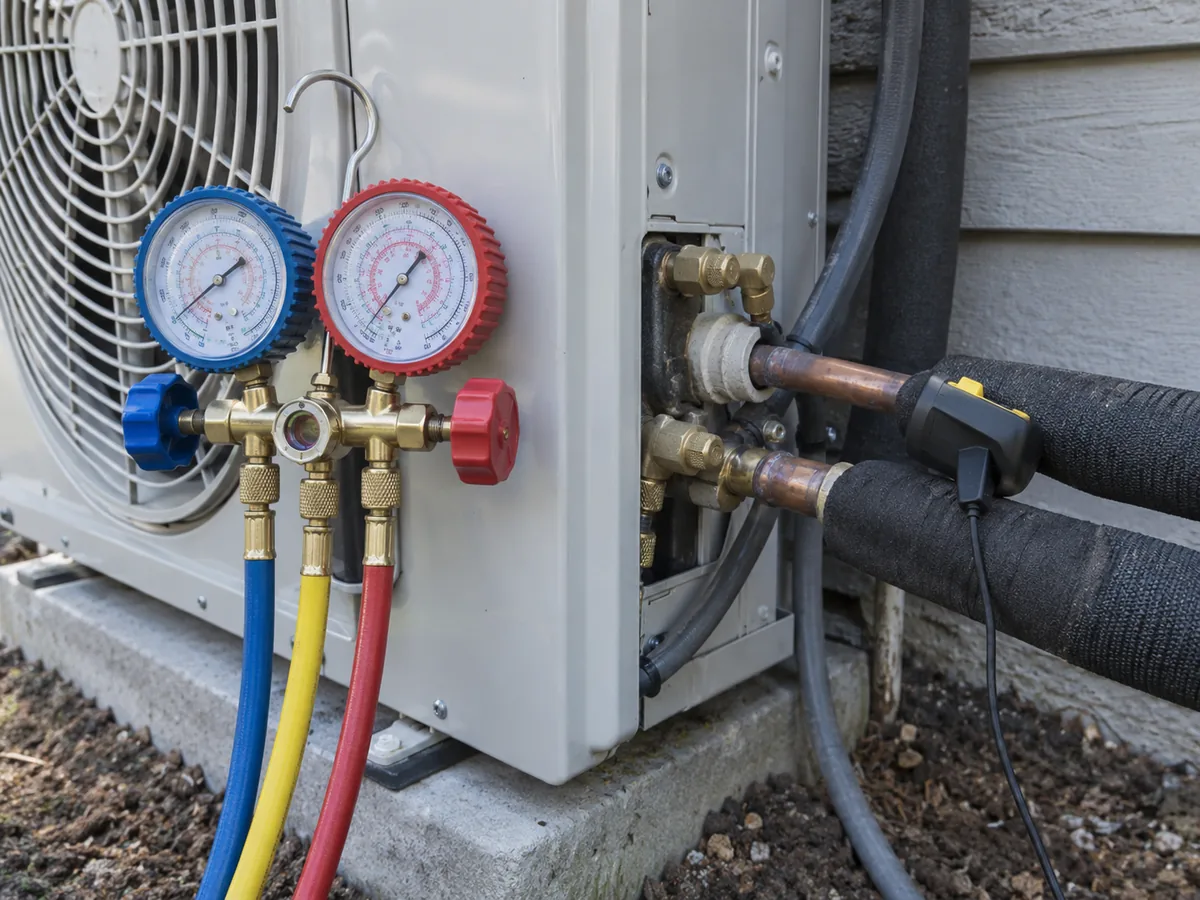
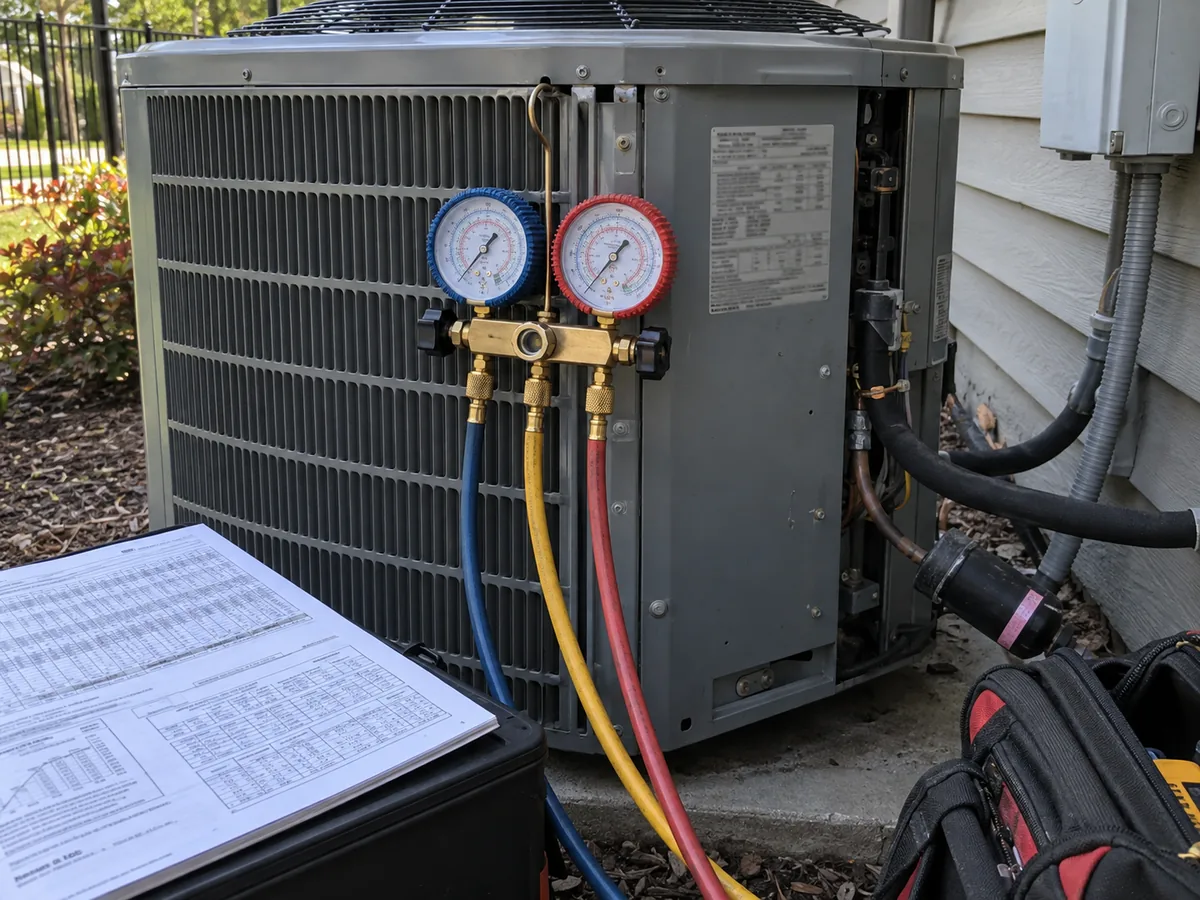
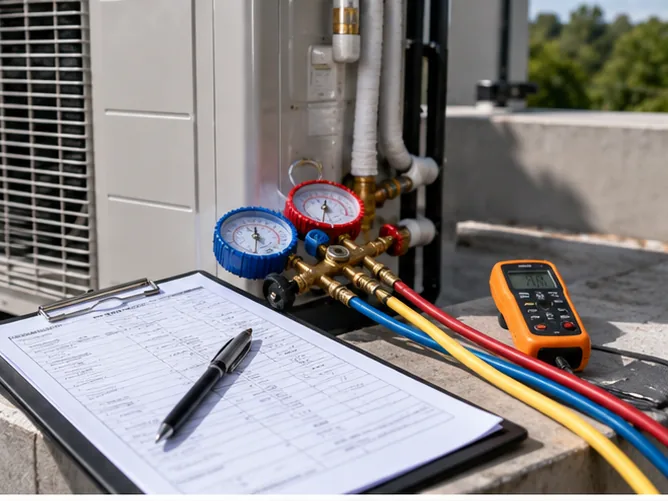
When we check an R32 system, we use the chart step by step. First, confirm that the equipment is designed for R32. Next, check the pressure unit and whether the gauge shows gauge pressure or absolute pressure. Then use the chart to find saturation temperature. After that, measure the correct refrigerant pipe at a stable point. Compare the pipe temperature with the saturation temperature. Only then should you add load and operating conditions and judge what the system is doing.
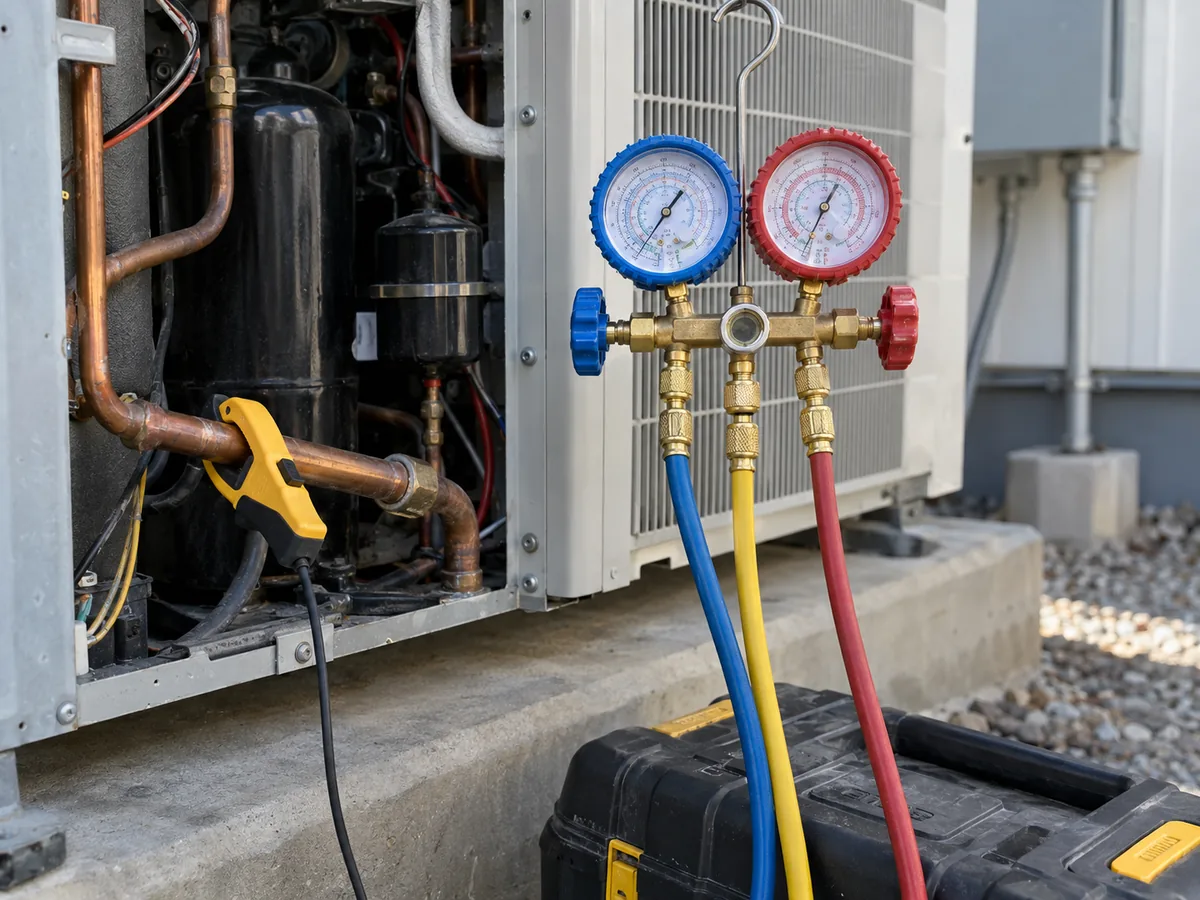
For example, about 121 psig matches about 40°F (4.4°C) saturation temperature on this R32 pressure temp chart. That does not mean the suction pipe or liquid pipe is actually 40°F. It only means 40°F is the saturation temperature that matches that pressure.
If you only have pressure, stop after finding saturation temperature. To check superheat or subcooling, you also need an accurate pipe-temperature reading. To judge refrigerant charge or overall system condition, you must also follow the manufacturer’s service method and check the real operating conditions.
Using the R32 PT Chart for Superheat and Subcooling
To check superheat, first use the low-side pressure to find R32 saturation temperature. Then compare that temperature with the measured suction-pipe temperature. Superheat tells you how much warmer the refrigerant vapor is than its saturation temperature.
Superheat = measured suction-line temperature − saturation temperature from the R32 PT chart.
Example: if the low-side pressure is 121 psig, the chart gives about 40°F saturation temperature. If the suction line is 52°F, the calculated superheat is 12°F. This is only a math example. 12°F is not a universal R32 target. The correct value depends on the equipment, metering device, controls, load, and manufacturer instructions.
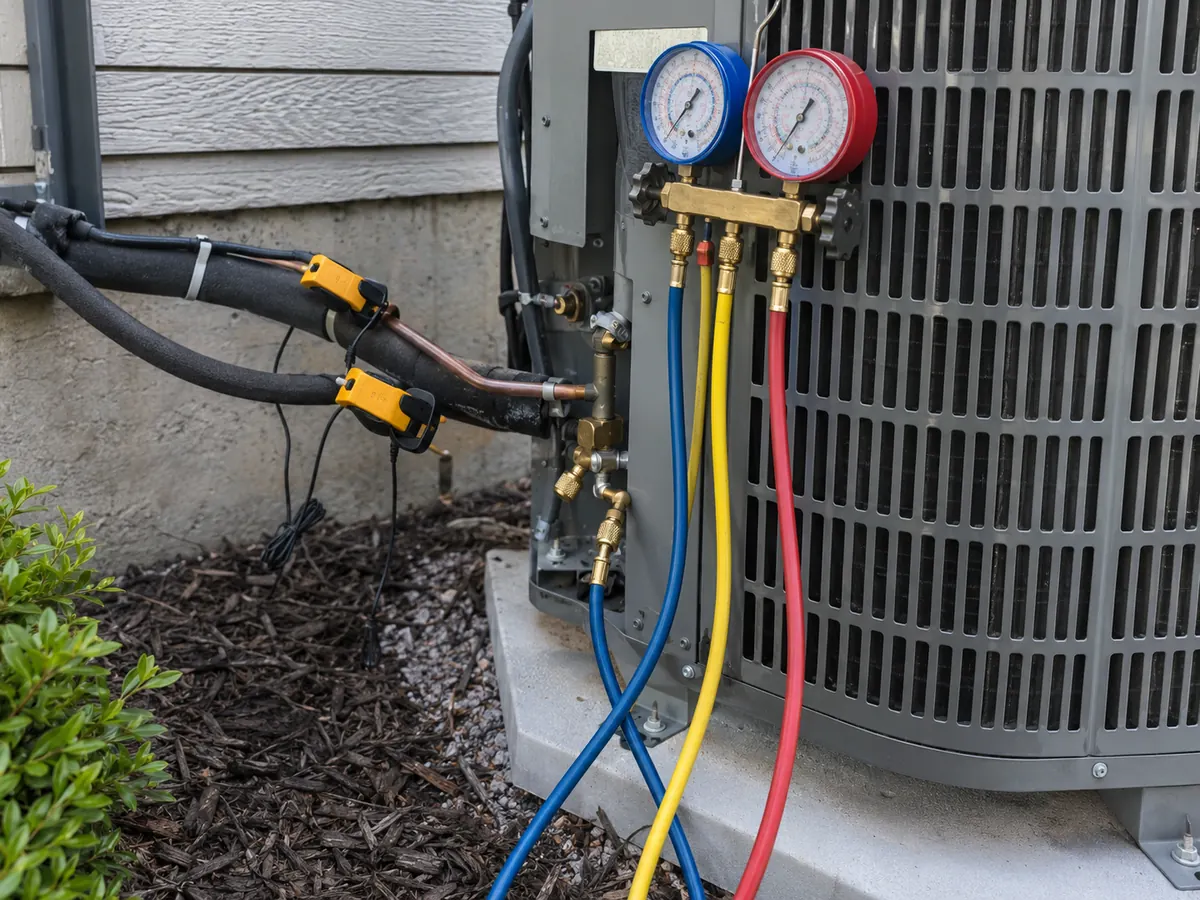
To check subcooling, first use the high-side pressure to find saturation temperature. Then compare that result with the measured liquid-pipe temperature. Subcooling tells you how much cooler the liquid refrigerant is than its saturation temperature.
Subcooling = saturation temperature from the R32 PT chart − measured liquid-line temperature.
Example: if the high-side pressure is 325.7 psig, the chart gives about 100°F saturation temperature. If the liquid line is 92°F, the calculated subcooling is 8°F. Again, 8°F is not a universal charging target. Inverter systems and electronic expansion valves may use different start-up and charging checks than fixed-speed equipment.
When we check superheat or subcooling, we also need to know the operating mode, indoor and outdoor temperatures, compressor state, airflow or water flow, and the manufacturer’s test condition. The math can be correct and still lead you to the wrong answer if the system was measured under the wrong conditions.
Gauge vs Absolute Pressure: Why the Difference Matters
Refrigerant property data is based on absolute pressure, which includes atmospheric pressure. Most field gauges show gauge pressure, which is pressure above the local atmosphere. That is why many HVAC PT charts use psig or bar(g): those are the units technicians normally see on a gauge.
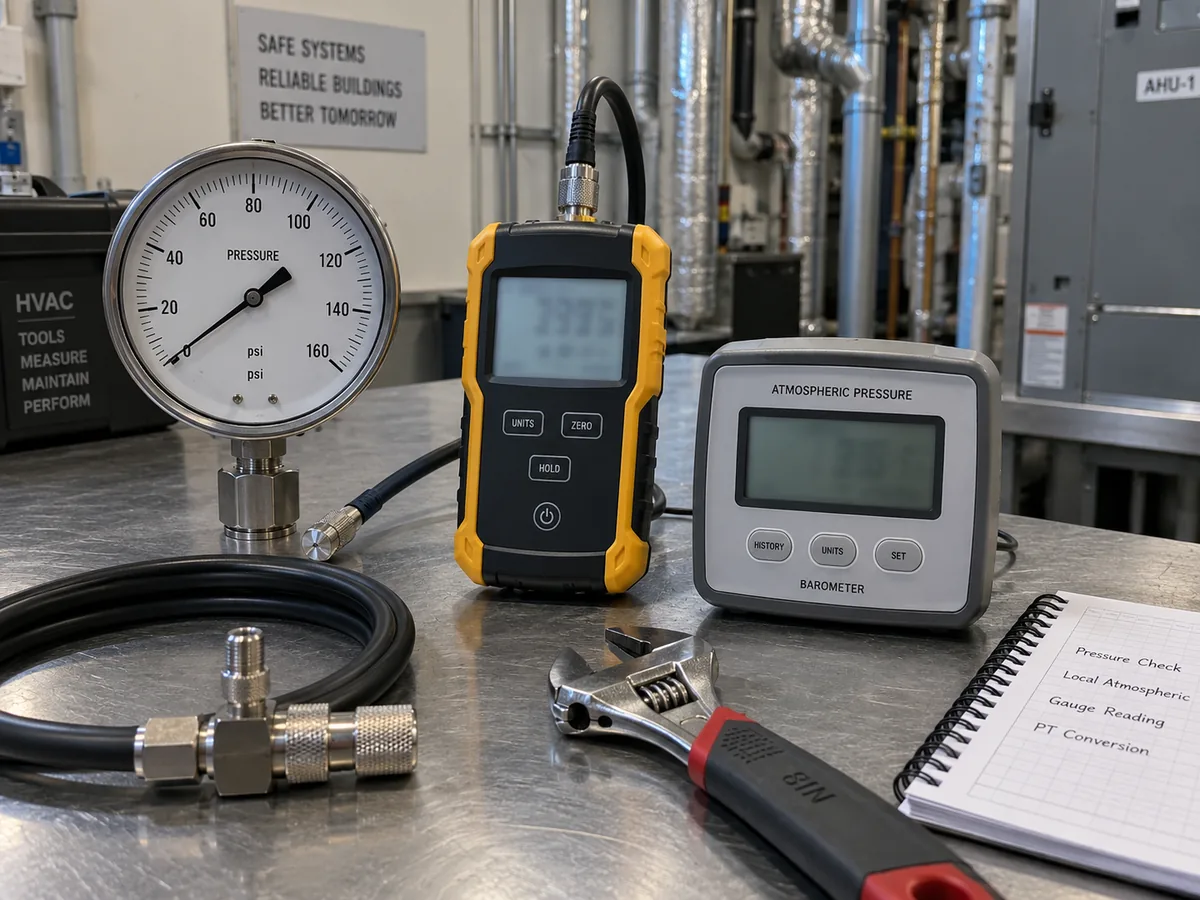
At higher elevation, atmospheric pressure is lower. This can create a small difference between a sea-level gauge-pressure chart and an absolute-pressure reference. If you need high accuracy at altitude, use an altitude-aware digital instrument, absolute-pressure data, or the method required by the equipment manufacturer.
Keep the pressure type consistent. psig, bar(g), and kPa(g) are gauge-pressure units. psia, bar(a), and kPa(a) are absolute-pressure units. Changing psi into bar or kPa does not change gauge pressure into absolute pressure.
Common R32 Pressure Mistakes and What We Check Next
| What You See | Why It Can Mislead You | What We Check Next |
|---|---|---|
| Using an R410A chart for R32 | The pressures can look similar in some ranges, but the saturation values are not the same | Check the refrigerant on the nameplate and manual, then use the correct R32 chart |
| Treating one pressure reading as “normal” | Running pressure changes with load, outdoor temperature, compressor speed, airflow or water flow, and controls | Record the operating conditions before judging the pressure |
| Trying to charge the system by pressure alone | Pressure alone does not tell you the refrigerant charge amount | Follow the manufacturer’s charging or start-up method |
| Using a poor pipe-temperature reading | Poor sensor contact, insulation, or measurement location can change the superheat/subcooling result | Fit the sensor firmly to clean pipe and check the instrument accuracy |
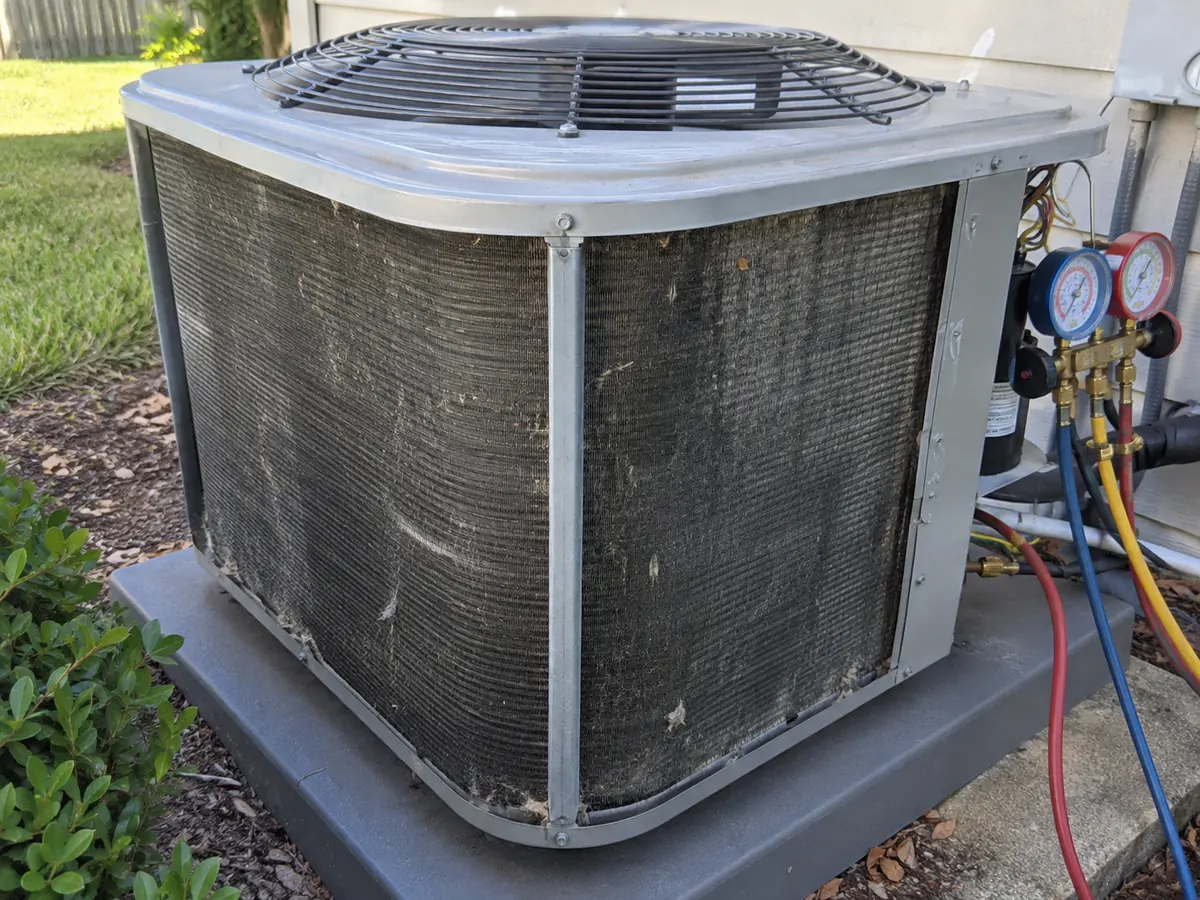
| Blaming refrigerant charge for every abnormal pressure | Low airflow, dirty heat exchangers, metering faults, or control problems can create similar pressure symptoms | Check flow, coil condition, valves, sensors, and controls before deciding the cause |
| Mixing gauge pressure and absolute pressure | The right number on the wrong pressure basis gives the wrong saturation temperature | Check whether the value is psig/psia or bar(g)/bar(a) before using the chart |
An abnormal pressure is a symptom, not the cause by itself. We first turn pressure into saturation temperature. Then we check pipe temperature, load, airflow or water flow, heat-exchanger condition, the metering device, sensors, controls, and the service method for that equipment.
Checking an R32 Operating Point?
Send us the refrigerant pressure, pipe temperature, indoor/outdoor conditions, operating mode, and equipment model if available. We can tell you what information is still missing before you make an equipment or system decision.
R32 vs R410A PT Charts: Similar Does Not Mean Interchangeable
R32 is one part of the R410A refrigerant blend, so their pressures can look similar in some air-conditioning conditions. But their saturation values are not the same. Using the wrong chart can give you the wrong superheat, subcooling, or service conclusion. An R32 pressure chart is not an R410A chart.
If the nameplate and manual say R410A, the unit does not become an R32 system just because the pressures look similar. The refrigerant is part of the equipment design, components, controls, safety requirements, and approvals. Use the refrigerant and service information specified for the equipment.
If you are comparing refrigerants for a heat-pump project, our R290 vs R32 guide explains the main engineering and safety differences. We do not treat one refrigerant as a drop-in replacement for another.
R32 A2L Safety: What You Need to Know
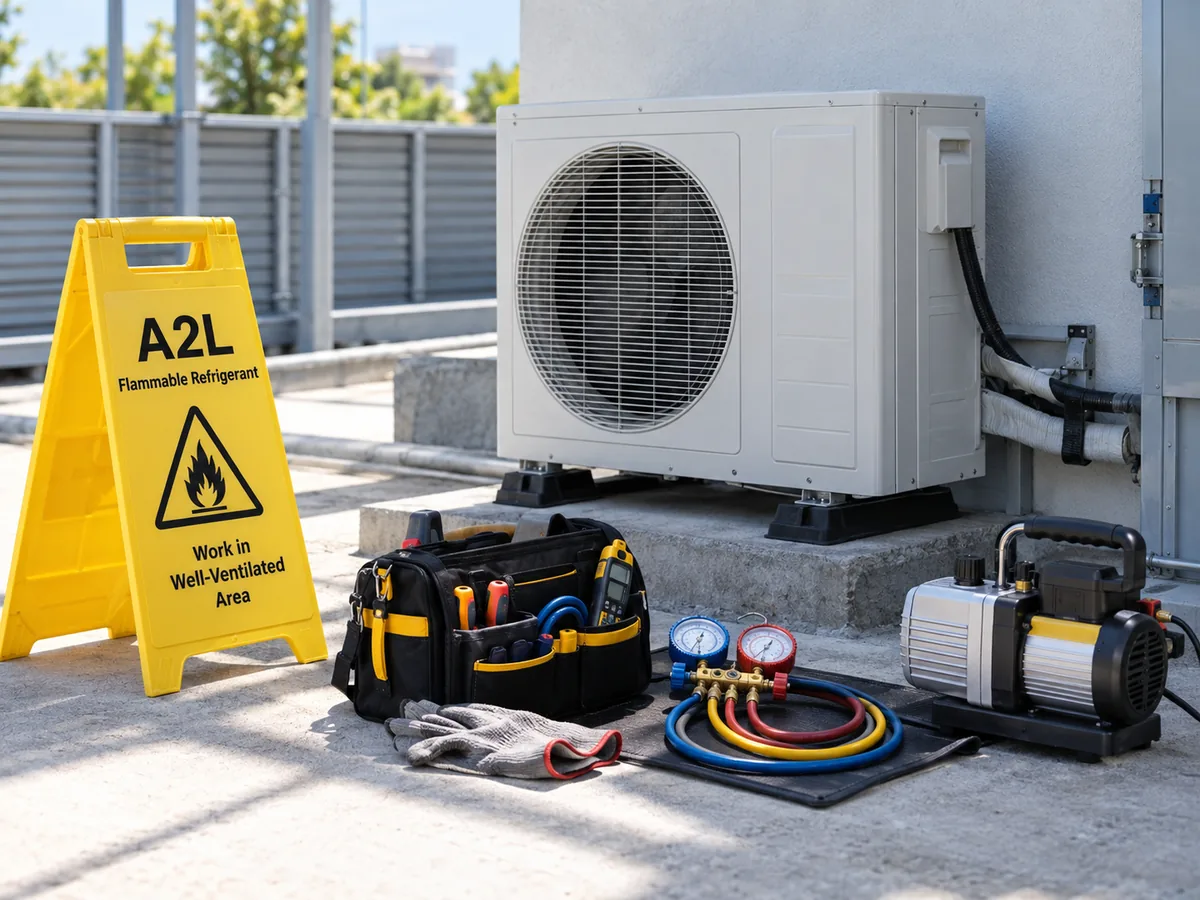
R32 has an A2L safety classification. In simple terms, it has lower toxicity and lower flammability than refrigerants in higher-flammability classes. Reading a PT chart does not require you to open the refrigerant circuit. But recovery, evacuation, charging, brazing, leak repair, and other work on the sealed circuit must be done by trained people using suitable tools and the rules that apply in the local market.
For global equipment safety, IEC 60335-2-40 covers electric heat pumps, air conditioners, and related equipment within its scope. ASHRAE Standard 34 provides refrigerant names and safety classifications. In the United States, EPA SNAP listings add U.S.-specific use conditions for HFC-32 in covered applications. Always follow local code, product certification requirements, and the manufacturer’s instructions for the destination market.
A PT chart is not permission to skip A2L safety steps. Before anyone opens the refrigerant circuit, confirm the refrigerant, ventilation, ignition-source control, approved service tools, access procedures, and the latest equipment manual.
How We Use R32 PT Data When Matching Equipment
PT data helps us see what is happening inside the refrigerant circuit. But it cannot size your project or choose an exact model by itself. When we review an R32 application, we separate what the PT chart can tell us from the project information we still need from you.
| Application | What PT Data Helps Us See | What It Cannot Tell Us | What We Need From You | When We Stop Before Exact Model Selection |
|---|---|---|---|---|
| R32 inverter air conditioner | Evaporating and condensing saturation temperatures | The capacity you need or the exact model | Required capacity or load, outdoor design temperature, room condition, power supply, installation limits | No reliable cooling/heating load or required capacity. |
| R32 air-to-water heat pump | What is happening in the refrigerant cycle | Required leaving-water temperature (LWT) or heating output at the design outdoor temperature | Outdoor design temperature, supply/return water temperatures, water flow, load, power supply | No design-point heat load, design outdoor temperature, or required water temperature. |
| R32 pool heat pump | What is happening in the refrigerant circuit | The exact heat-pump size or pool heating time | Pool volume, outdoor temperature, inlet/target water temperature, required heating duty | No pool volume, target water temperature, or design ambient condition. |
| System operating check | Saturation temperature plus superheat/subcooling checks | The cause of a problem from pressure alone | Pressure, pipe temperature, outdoor/indoor conditions, operating mode, airflow or water flow, control state | Only one pressure reading is available, with no pipe temperature or operating context. |
This matters because rated capacity is not the same as the heating or cooling output at your real design condition. Pressure also cannot tell us your building load, required water temperature, pool heating duty, power-supply fit, or certification needs. The PT chart helps us understand the refrigerant side. Your real project conditions decide which products are worth comparing.

What to Send Airproz for an R32 Project or RFQ
If you want us to review an R32 project or prepare a request for quotation (RFQ), send the information that can change the equipment choice. With these details, we can narrow the product family without pretending that one pressure reading can select a machine.
| Input | What to Send Airproz |
|---|---|
| System / application | Comfort cooling, space heating, domestic hot water, pool heating, or another supported use |
| Required capacity | Cooling/heating requirement or design load. Floor area alone is not enough |
| Outdoor design temperature | The outdoor temperature used for sizing, plus the required operating range |
| Target indoor or water temperature | Required indoor temperature or water supply/return temperatures |
| Power supply | Voltage, phase, and frequency |
| Installation limits | Available space, piping or line length, water-system limits, service access, and noise limits if relevant |
| Destination market | Country or region, plus any required certification or local code needs |
| Quantity | Project or order quantity |
| Existing problem, if there is one | Refrigerant type, pressure, pipe temperature, indoor/outdoor conditions, operating mode, airflow or water flow, and control state |
For R32 comfort cooling, start with our R32 inverter air conditioner range. For water-based space heating, start with our R32 monobloc heat pump range. We still need the real project conditions and verified product data before we can confirm an exact model or setup.
Choose the Next Step That Matches Your Job
Equipment selection: send us the application, required capacity or load, design ambient, target indoor or water temperature, power supply, installation limits, destination market, and quantity.
Operating-point review: send the refrigerant pressure, pipe temperature, indoor/outdoor conditions, operating mode, airflow or water flow, control state, and equipment model if available.
Frequently Asked Questions
What pressure should R32 be at?
There is no single R32 pressure that is correct for every system. First, use the pressure to find saturation temperature. Then check it against the real load, indoor and outdoor conditions, airflow or water flow, compressor and control state, and the manufacturer’s expected operating condition.
What is the R32 pressure at 40°F saturation temperature?
About 121 psig, or 8.34 bar(g), on this R32 PT chart. That is a saturation reference. It is not a universal suction-pressure or discharge-pressure target.
What is the R32 saturation temperature at 121 psig?
About 40°F, or 4.4°C. This is the saturation temperature that matches 121 psig. It is not automatically the actual pipe temperature.
Can an R32 PT chart tell me whether the refrigerant charge is correct?
No. The chart can give you saturation temperature for superheat or subcooling checks. To judge refrigerant charge, you still need the manufacturer’s charging or start-up method and the real operating conditions.
Does R32 need separate bubble-point and dew-point temperatures?
For normal HVAC PT-chart use, no. R32 is a single-component refrigerant with almost no temperature glide, so we use one saturation relationship as the reference.
Is an R32 pressure chart the same as an R410A PT chart?
No. Their pressures can look similar, but their saturation values are not identical. Use the PT chart and service method for the refrigerant named by the equipment manufacturer.
Can PT data select an R32 air conditioner or heat pump?
Not by itself. PT data helps us understand the refrigerant side of the system. To match equipment, we still need required capacity or load, outdoor design temperature, target air or water temperature, power supply, installation limits, destination market, and other project details.